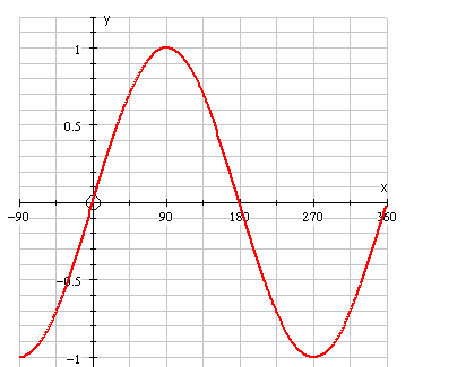
Graph of y = sin x
The graph below shows the sine wave in degrees.
When dealing with angles it is often necessary to work in radians. Whereby 360° = 2π radians.
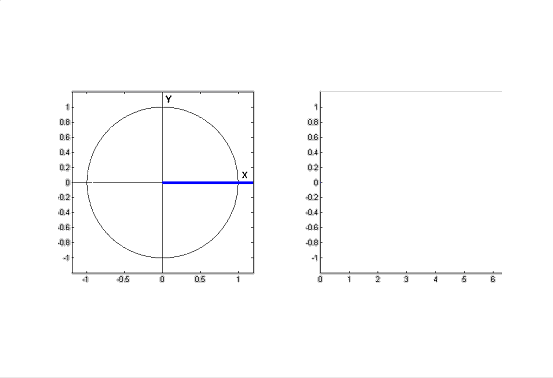
Because of the cyclic nature of the wave it is possible to map the behaviour onto what is know as a quadrant diagram.
Please click the graph to show how this is built up.
The sine function
1. This graph is continuous (there are no breaks).
2. The range is
3. The shape of the graph from
= 0 to
is repeated every 2
4. This is called a periodic or cyclic function and the width of the repeating pattern that is measured on the horizontal axis, is called the period.
The sine wave has a period of 2
5. The greatest value of the sine wave is called the amplitude.