Quantitative Methods - Unit 1 > Straight Line Graphs


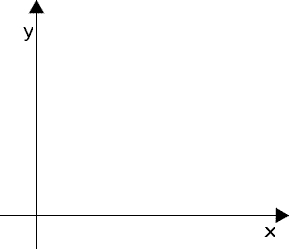
Introduction
 

A graph has 2 axes (lines):

  • The horizontal axis is the x axis.
  • The vertical axis is the y axis.

This is a picture of a set of Graph Axes:  The x-axis is the horizontal one, and it is labelled  with an arrow and a letter X; likewise the y-axis has an arrow and a y and is the vertical line